
Data Stream Mining with Cube
Time-series data analysis can be approached in two ways. Traditionally time-series data is aggregated into partitioned historical data bases, and then reported on at scheduled intervals. Commonly, reports delivered today cover data collected yesterday. A modern (and perhaps most relevant to Big Data) approach is to recognize that time-series data just “keeps coming”. And since the timeliest analysis could theoretically deliver the most value, visualizations should update as soon as the data streams in.
Square’s evolving Cube library (it’s still early version 0) enables web developers to easily deliver real-time charting of streaming time-series data on dynamic web pages:
Cube is an open-source system for visualizing time series data, built on MongoDB, Node and D3. If you send Cube timestamped events (with optional structured data), you can easily build realtime visualizations of aggregate metrics for internal dashboards.
I’ve spend a large chunk of my professional life working at IT system management vendors, each of whom spent significant resources to build and deliver proprietary event and time-series data analysis and visualization tools. In the last few years there have been successful open source discrete event monitoring and management tools (threshold, alert, etc) that really disrupted the market of old school proprietary event solutions. Open source time-series solutions like Cube have similar potential to disrupt proprietary time-series analysis markets.
Time-Series Data Stream Mining
Real-time time-series visualization is fundamentally data stream mining, maybe not at Big Data scales but certainly there are some hints about the future for Big Data stream mining in the way Cube is architected.
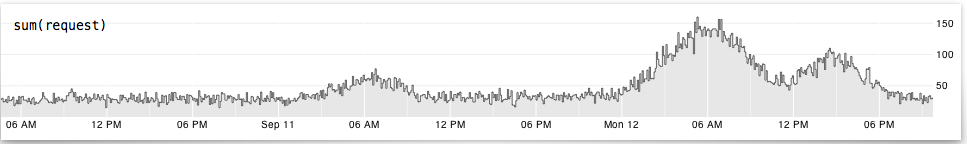
Events are submitted asynchronously through WebSockets (or HTTP POST), then stored in a MongoDB, which can handle arbitrary JSON documents. Queries are handled by outbound evaluators which compute and forward computed results asynchronously on requested intervals. A query is a straightforward declaration of event/document type, an optional field or computation (default is just to count the event), an optional chain of filters, and a reduce function (like “sum”).
Performance is enhanced by a capped caching implementation and pyramidal aggregation of the streaming data. Pyramidal aggregation is basically built-in auto-summarization of computed metrics by multiples of the requested computed metric interval.
Cube comes with a built-in dashboard creator that enables anyone to quickly assemble and share a dashboard made from predefined chart components. It’s also possible to create custom charting. Cube’s dashboard definitions are stored and served over websockets, so you can edit them and users will see your dashboard edits live.
(Does this make a Cube web page a data driven document, a data document, a document pointing to data, a data mine or a data source? Probably yes to all.)