
Who Will Drive Data Driven Documents?
Check out this javascript library D3 for “Data Driven Documents” (D3 on Github). At first D3 seems to be just yet another way to add graphs and charts to web pages, but if you spend a few minutes soaking it in you can see how it might change how people think about data and documents altogether.

Like anything that changes our mental paradigm it takes a bit of noodling to wrap your head around it. D3 is similar to basic jQuery with the twist that you can add and transform data attached to arbitrary DOM elements, then use that data to drive the visualization and behavior of the DOM dynamically.
D3.js is a small, free JavaScript library for manipulating documents based on data.
D3 allows you to bind arbitrary data to a Document Object Model (DOM), and then apply data-driven transformations to the document. As a trivial example, you can use D3 to generate a basic HTML table from an array of numbers. Or, use the same data to create an interactive SVG bar chart with smooth transitions and interaction.
Data Driven Functions
There are some clever things to be done in just a few lines of code when you use D3 to map what might normally be static attributes of your CSS/HTML/SVG (or other DOM elements) to data driven functions. D3 provides:
- CSS selectors (like jQuery) plus hierarchically grouped sub-selector iterators for nested data/elements
- Visual Transitions and real-time interaction driven by data functions
- Attaching/transforming arbitrary data with any DOM element
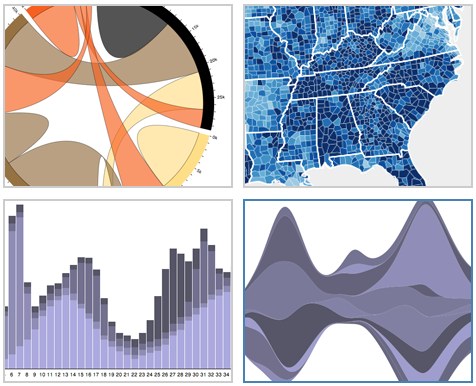
- Convenient SVG-based elements with advanced modules for streamgraphs, force-directed graphs, treemaps, Voronoi diagrams, geographics, et.al.
Is Data Content or Context?
I think the biggest reason to think about D3 is not that it enables “data driven documents”, which is very cool itself, but that it might represent a new wave of data as document. We already know HTML documents (DOM) are data, but this takes it to another level.
Data attached and expressed within a DOM seems at first about that data providing supporting visual/numerical context for the whole document content. But the data we are adding to the DOM is not just additional text or text structure, but quantitative data integrated intimately with the content of the whole document.
It’s data presented in context.
Big Data Analysis Challenge?
In a big data world this helps each document stand alone and tends to make the entire “set” more valuable (as a library resource of individual documents), but might make big data analysis across all of them perhaps more challenging again.